Damage easier to detect in 3D
It's now easier than ever to detect damage or contamination in machinery and equipment using the B&R APROL process control system. Vibration measurement results are now visualized in an interactive 3D graphic to help plant operators and maintenance technicians optimize performance.
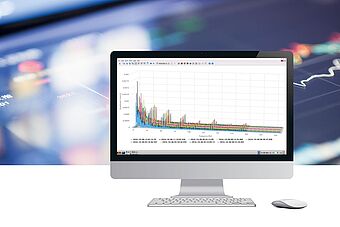
Clear overview of FFT
The vibration measurement system uses a fast Fourier transform (FFT) to identify disturbance frequencies. 3D graphics make the results easy to interpret. With multiple measurement series displayed simultaneously, changes in measurement points can be seen at a glance.
Automatic harmonic calculations
Calculating harmonics can help identify which frequency is causing a vibration. The first harmonic is defined manually by selecting a peak. The remaining harmonics are calculated automatically and displayed in the 3D graphic.
Detect damage early
Marking sidebands helps to identify errors with specific frequencies. The user defines the base band and the first side band manually. APROL then automatically calculates and highlights the remaining side bands. These tools help users identify damage frequencies quickly and easily for early detection of damage or contamination.